
Design and production art
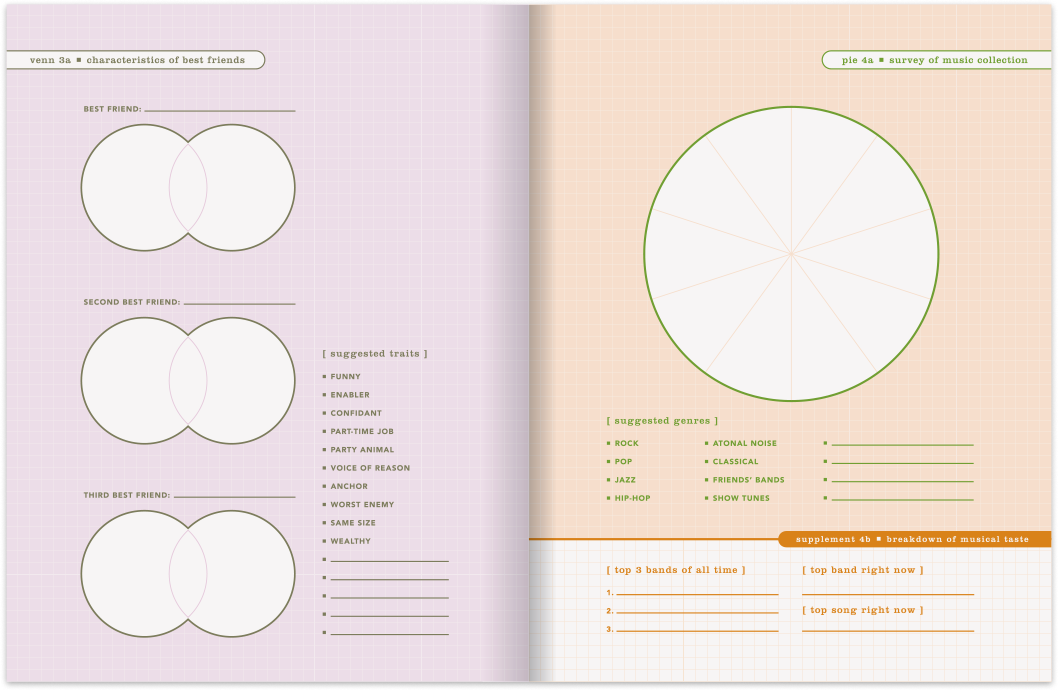
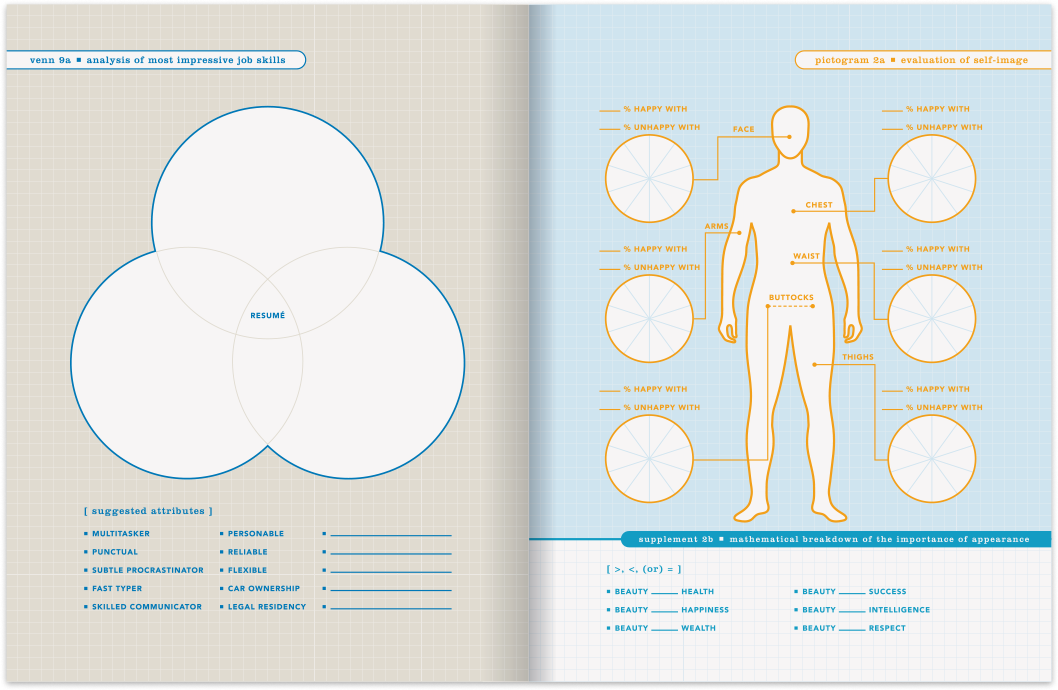
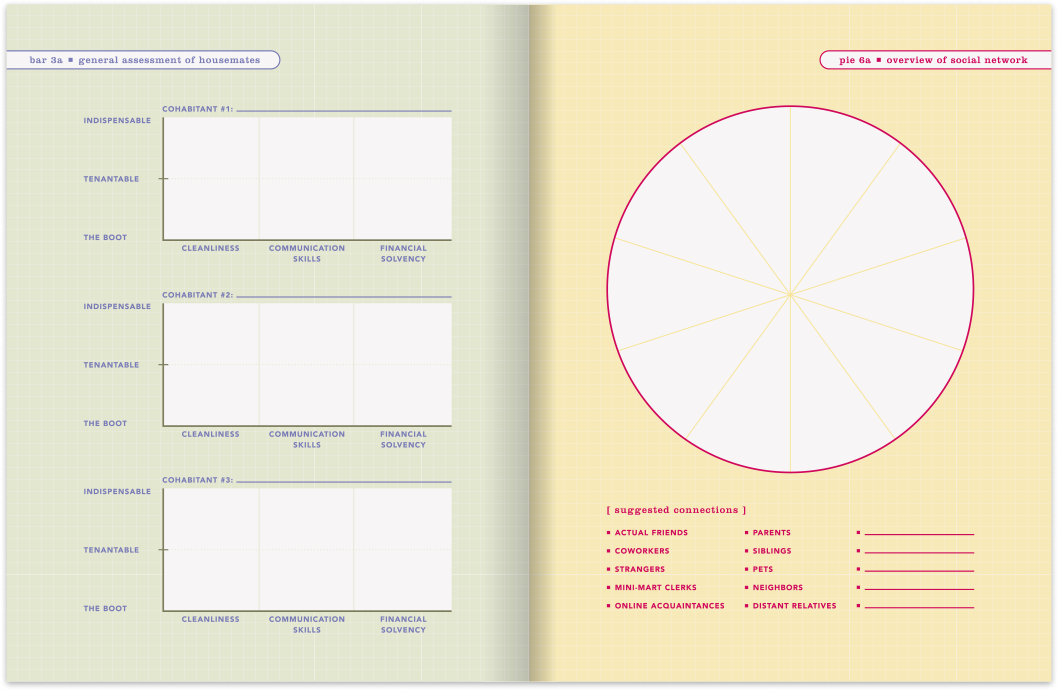
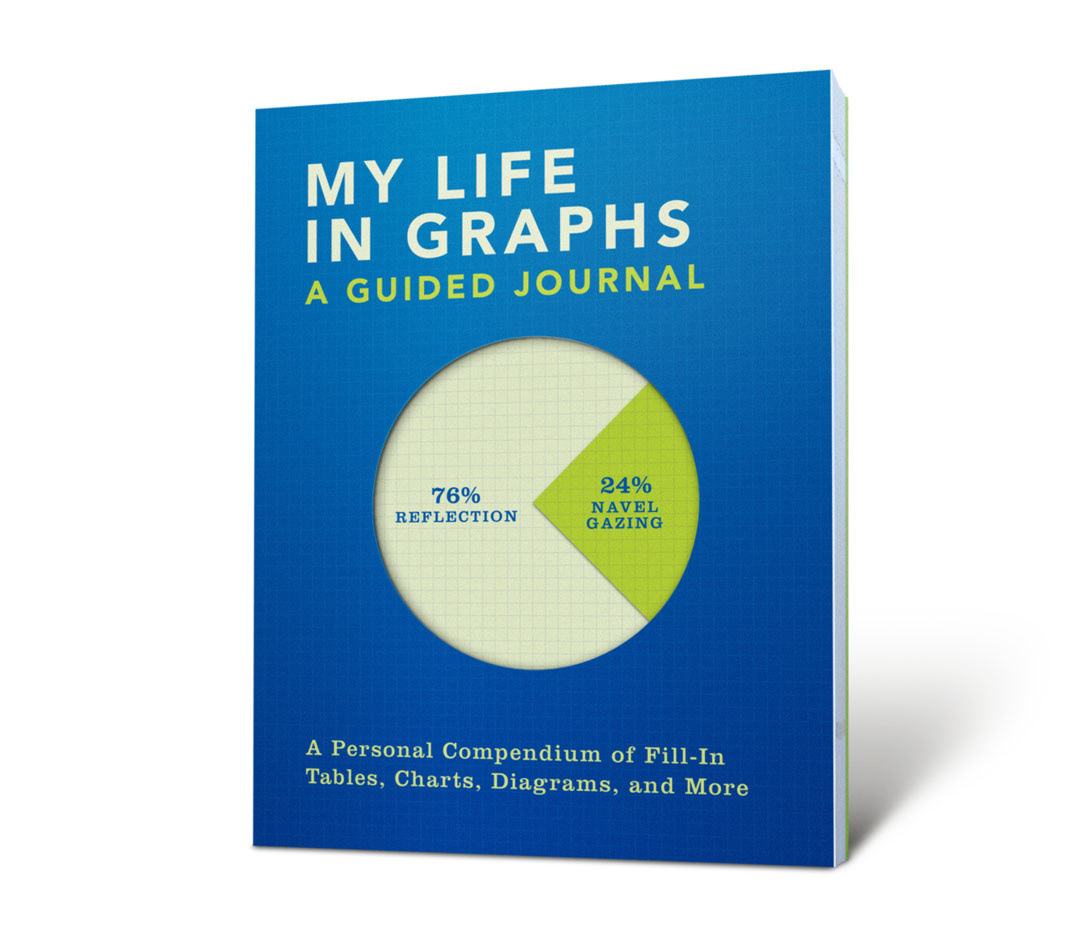
My Life in Graphs is a semi-serious guided journal that helps the user on the road to self-discovery — or, barring that, self-quantification — with an assortment of fill-in charts to answer various prompts.
The cover has a die-cut hole to suggest a pie chart, and the "26% Navel Gazing" area is a die-cut extension of the front cover, folded over to complete the pie chart. This element doubles as a bookmark while the journal is in-progress.
Below is a selection of spreads that showcase just a few instances of page design.